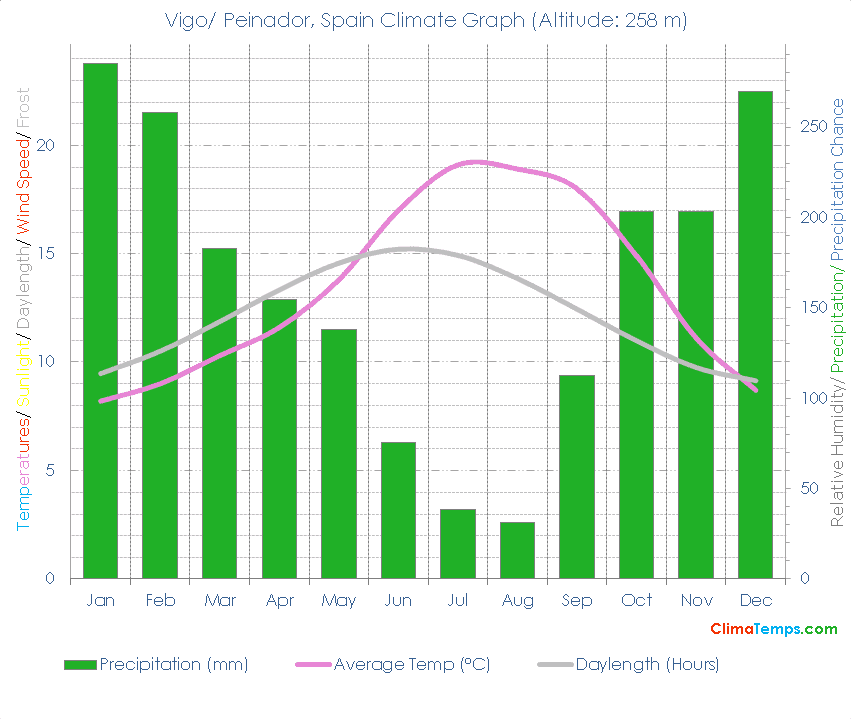
The first graph shows the climate in Vigo/ Peinador, Spain in metric units and the second in English units. The climate graphs depict monthly average temperatures, precipitation, wet days, sunlight hours, relative humidity and wind speed.
Vigo/ Peinador, Spain Climate Graph in Metric Units
Vigo/ Peinador, Spain Climograph in English Units
Your Share Will Make An Essential Difference!
Please take a moment to share a climate graph or simply the address:
Thank You, so much! ❤️